The course has the right balance between theory and practical which is valuable for understanding. This course provided me exposure to real-time projects and also gave me the first job in my data science career.
Discover the essence & power of Analytics and data visualzation in Kolkata. This course provides hands-on training, equipping you with essential skills & unleash the power of data interpretation & storytelling for insightful decision-making. Join us to elevate your proficiency and advance your career in the dynamic field of data analytics.
Limited Seats
Looking for a comprehensive Tableau amd Power BI Certification Course & Training in Kolkata? Look no further! This hands-on course is designed to help you understand and use data to find meaningful answers to business questions. Whether you’re a beginner or an expert, this course will teach you how to visualize data, analyze it, and understand trends more effectively. By the end of the course, you will be able to enable faster and smarter decision-making in your organization.
The PowerBI and Tableau Course in Kolkata covers all aspects of the Tableau architecture, data visualization, and working with Tableau graphs. You will learn how to create and use parameters, filters, maps, dashboards, and table calculations to analyze and visualize your data. With this training, you will be able to effectively communicate your findings to stakeholders and make informed decisions based on your data.
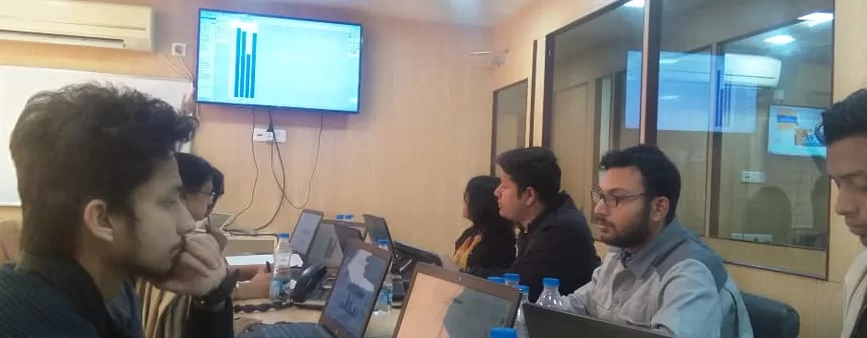
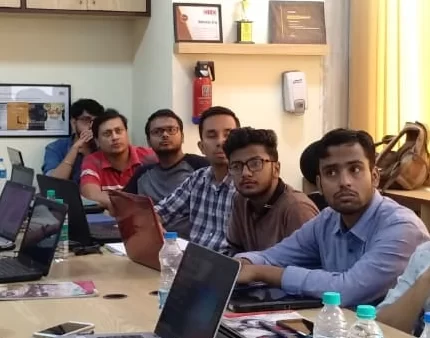
The course is led by expert instructors who have years of experience working with Tableau & PowerBI. They will guide you through the course material and provide hands-on exercises to reinforce your understanding of the concepts. You will have access to real-world datasets, allowing you to apply what you learn to practical scenarios.
Whether you’re looking to enhance your skills or jumpstart your career in data analytics, the data visualization course is the perfect opportunity in Kolkata. Join us today and take your data visualization and analysis skills to the next level!







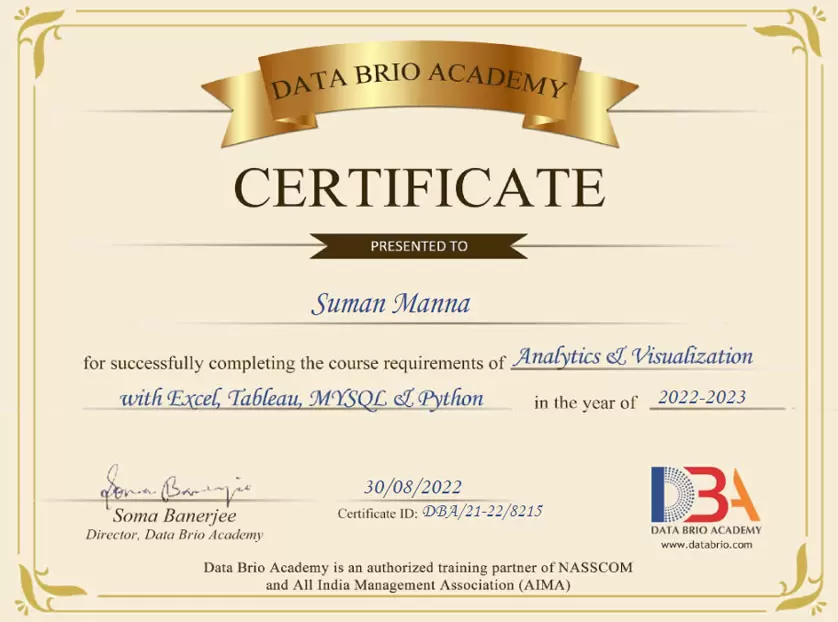
The course has the right balance between theory and practical which is valuable for understanding. This course provided me exposure to real-time projects and also gave me the first job in my data science career.

Anybody looking for a career in data science, I would suggest them to go to Data Brio Academy not only for their expertise in the subject but because of the industry exposure the team has and the eco-system they provide for learning data science and AI.

DBA provided ample exposure to practical projects in data science with emphasis on understanding the project life cycle. This course helped me shift into data science role in one of the ‘big’ consulting firms from telecom networking.

Very knowledgeable instructors with real-world experience, which is very important for anyone interested in moving into the data science field.

Overall experience is great. Interaction with faculties helped me gain knowledge and motivated me towards pursuing a career in analytics and data science.

I am a scientist. My every day research work involves lot of data analysis including quite involved statistical techniques and even in that context the data science course at DBA has been very useful for me. The faculty who took the bulk of the course is a brilliant teacher.

Our certified professionals, mentored by experts and connected to top employers, are shaping the future of data science at leading MNCs.