Important Python Interview Questions and Answers

Are you applying for a job that involves knowledge of Python? With the continuous growth of this versatile programming language, a career path in this field will fetch multiple opportunities. However, proper preparation is crucial for nailing the Python interview questions. Here are some of the important interview questions that you may face in your […]
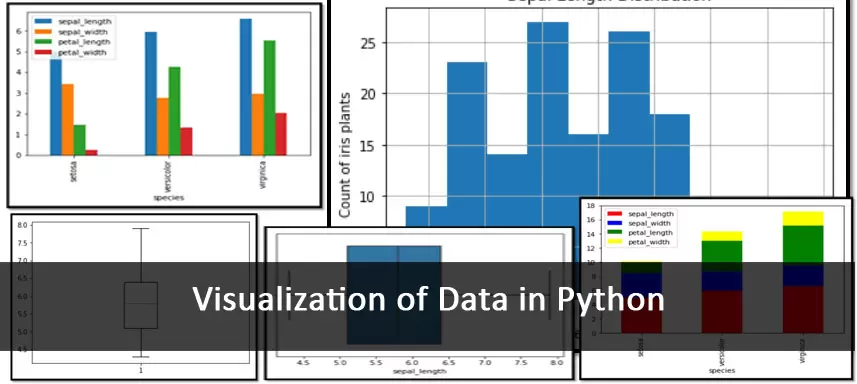
Visualization of Data in Python – Part 2

We have already discussed data visualizations in python and saw how to create histogram, boxplot, barcharts and line charts in part 1 of the blog. Continuing the discussion we will further discuss about other chart types like Scatter Plot, Bubble Plot and Heat Maps – their implementation in python. Scatter Plot and Bubble Plot Scatter […]
