Let us look at the steps to follow to perform Analysis of Variance(ANOVA). This would be very clear and easy to follow. ANOVA is used to analyze the difference in the means of different groups (for 3 or more groups).
The procedure is made up of just three basic stages.
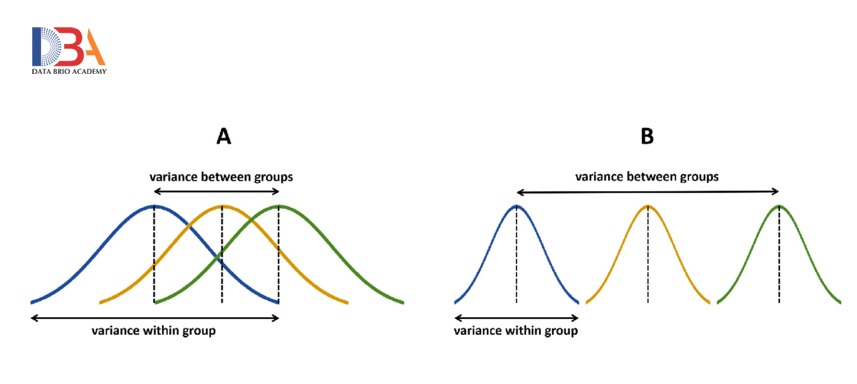
Let’s take some time to examine Figure 1. This figure summarizes what needs to be calculated to perform a one-way ANOVA.

Step 1: Calculate all the means
You need to calculate all the means for all the groups in the question. Then you also need to calculate to overall means with all the data combined as one single group.
Step 2: Set up the null and alternate hypothesis and the Alpha
The null hypothesis assumes that there is no variance data in different groups. In other words, the means are the same
The alternate hypothesis states the means are different. So we can state as follows:
H0: μ1 = μ2 = μ3
Ha: μ1 ≠ μ2 ≠ μ3
Step 3: Calculate the Sum of Squares
Calculate the Sum of Squares Total (SST): The SStotal is the Sum of Squares(SS) based on the entire set in all the groups. In this case, you treat all the data from all the groups like on a single combined set of data

Calculate the Sum of Squares Within Groups (SSW): The is the sum of squares within each group. After calculating the sum of squares for each group, then you add them together for all the groups. That is why you have the sum symbol twice in the formular
- The internal sum is for within the group
- The external sum is to sum the sums!

Note: If you have calculated the first two sum of squares, you can the go-ahead to calculate the third on using the first two values using the formula
But for learning purposes, we would calculate the third one. So let’s keep moving!
Calculate the Sum of Squares Between Groups (SSB): This is the sum of squares with the groups taken as single elements.
Assuming there are three groups you will have to do the following:
(group1_mean – total_mean)2 + (group2_mean – total_mean)2 + group3_mean – total_mean)2

Verify that SStotal = SSbetween + SSwithin
Step 4: Calculate the Degrees of Freedom (df)
Calculate the Degrees of Freedom Total (DFT)

where n is to total of all the data sets combined
Calculate the Degrees of Freedom Within Groups (DFW)

where k is the number of groups.
So, if there are three groups of measurements, then k = 3
Calculate the Degrees Between Groups (DFB)

Note: You could actually calculate the third degree of freedom if you have two of them just like in the case of the sum of square
You can verify that: dft = dfw + dfb
Step 5: Calculate the Mean Squares
Calculate the Mean Squares Between (MSB)

Calculate the Mean Squares Within (MSW)

Step 6: Create a Summary Table and Calculate the F Statistic
This is the same table you created in Step 2. You just have to fill it with actual results based on your calculations. Stating with this table makes the problem easier to solve.
Calculate the F Statistic using the formula

Step 7: Look up F from the table
Look up the tabulated value of F(critical value) F from the statistical table and compare it with the value you calculated (absolute value).
If the absolute value is greater than the critical value, we reject the null hypothesis and conclude that it is significantly different between the means of the populations. Otherwise, accept the null hypothesis or fail to reject the null hypothesis.
Article Credit: kindsonthegenius