Among the machine learning algorithms you may have heard about K-Means and KNN algorithms. These are widely used machine learning algorithms that are used in business use cases. Is the interpretation of k in K-means and KNN algorthims the same ? What’s a real-time business use case where K-means is preferred to KNN? We will understand today what kind of machine learning algorithms are K-Means and KNN and where they are used.
So you know now that K-means and KNN are both machine learning algorithms that are commonly used in data science. Before understanding the meaning of K in KNN and K-means, let us discuss how these algorithms work.
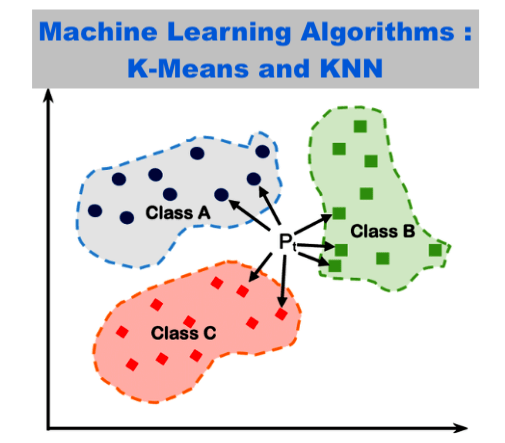
KNN – K- Nearest Neighbor
KNN is a supervised machine learning algorithm and is one of the simplest ones. The full form of KNN is K-Nearest Neighbour. The model predicts a new data point based on labeled-inputs the data already has. Suppose, if the height of a man is between(160cm-169cm) and weight between (66kg-70kg) the shirt size will be L, and if the height of a man is between(155cm-159cm) and weight between (60kg-65kg), then the shirt size will be M. So, height and weight are labeled inputs.
We call these labeled-inputs neighbors. The model predicts the label of a new data point ( a new height and weight value will have shirt size M or L) based on a distance between this new data point and the neighbors. More the number of votes from the nearest neighbor category, the new data point gets that label. This is where the ‘K’ comes into the picture. The value K is the total number of neighbors who do the voting, and the highest vote (or count) from the neighbor category gets to determine the label of the new data point.
So, as it comes down, the two important metrics to know about the KNN algorithm are the distance metric and determining the optimal number of K.
DISTANCE
Depending on the context of the problem at hand, several distance metrics can be used. The most important ones are:
- Minkowski Distance
- Euclidean Distance
- Manhattan Distance
Minkowski Distance
This is the parent distance metric which boils down to the other two metrics – Euclidean and Manhattan. These two metrics get their respective characteristic depending on the value of ‘p’ of the Minkowski metric.
The formula for the Minkowski distance =

where n= number of dimensions of the dataset
Euclidean Distance
When the value of p is 2 in the Minkowski metric, this metric takes the form of Euclidean distance metrics. The formula is as follows:

This distance is otherwise also called Pythagorean distance.
When do we use Euclidean Distance?
Euclidean distance metric gets heavily influenced by outliers and also when there are more dimensions. This is because the distance between the two points is being squared for multiple dimensions and the outliers with more dimensions also get highly amplified. Hence, in the case of data points with no outliers and fewer dimensions (ideally less than 5), Euclidean distance metrics are recommended.
Manhattan Distance
When the value of p=1, that is when we substitute the value of p by 1 in the Minkowski metrics, we get the Manhattan Distance. This can be shown by the following formula:

where n: number of dimensions.
Where can we use Manhattan Distance?
Unlike the Euclidean distance metric, calculating a Manhattan distance for high dimensional data is less influenced by outliers as the distance is getting calculated only by the absolute distance between two points. So, using Manhattan distance is recommended in this case.
How the algorithm works
The distance between a neighbor and the new data point is calculated using either Euclidean or Manhattan distance. This step is repeated for each of the neighbors. The highest number of votes belonging to the specific neighbor category labels the new datapoint as that category.
Determining the optimal value of K in KNN
The value K is the number of neighbors the model is considering to vote for the label of the new datapoint
Example: There are 9 pairs (one x and one y) of neighbors (x1,y1 –through x4,y4 belonging to Hill category & x5,y5 through x9,y9– belonging to Mountain category), where x and y are height and time of formation respectively. Let the new datapoint be (x10,y10). Our task is to find out, how many of the 9 neighbors will be considered to vote the new datapoint as Hill or Mountain.
| Categories of nearest neighbor | Pairs of nearest neighbor |
| Hill | (x1,y1),(x2,y2), (x3,y3), (x4,y4) |
| Mountain | (x5,y5),(x6,y6), (x7,y7), (x8,y8),(x9,y9) |
For K=1:
By using one of the metrics distance (say Euclidean), the algorithm calculates the distance between each of the neighbors (x1,y1 through x9,y9) and x10,y10. The algorithm then sorts the distance by ascending order, and suppose (x1,y1) gets the minimum distance. Since K=1, the model takes this lowest distance and Hill becomes the nearest neighbor. Because, x1,y1is a datapoint for hill, x10,y10 gets voted as a Hill.
For K=2:
By calculating the distance by the Euclidean metrics and sorting the points in descending manner, the top 2 minimum distances- say x1,y1, and x5,y5 is chosen as the top 2 nearest neighbors, then there is a tie between Hill and Mountain for the new data point.
For K=3:
By following the same method, now top 3 minimum distance is chosen and the nearest neighbors become say x1y1,, x5y5 and x6,y6, and the new point gets voted as a Mountain
…and so on.
So, as quite evident by the example, it is preferable to have the value of K as an odd number, so that a tie among the voting of neighbors can be avoided. In a situation like this, the category which gets voted for K=1 is sometimes considered to break the tie. In Python, the tie is avoided in the Sklearn module by choosing the nearest neighbor that appeared first in the given dataset.
Another factor that can be taken into consideration while choosing the value of K is the following:
increasing the value of K one by one and plotting the various values of error rate from the models and check where the error rate is getting constant so that increasing K does not substantially increase the accuracy of the model.
K-means clustering
K means algorithm is a clustering technique that is widely used in unsupervised machine learning problems. Clusters are groups where data points are put together based on their similar nature to discover an underlying pattern. More similar are these data points, more chance is the datapoint belonging to that cluster. K means cluster analysis is an unsupervised machine learning algorithm because, unlike KNN, it takes in un-labeled inputs and groups these observations in un-labeled clusters, which are later labeled by the data scientist.
Now, what is K?
The final number of clusters to which these data points belong is denoted by K.
K is also referred to as the number of centroids that is initially being chosen at random or by given knowledge and each centroid represents the center of that cluster.
How the model works
Suppose we start with 2 clusters – k1 and k2, and 10 data points (x1y1through x10y10). To initialize the algorithm, we randomly choose two datapoints (say x1y1 as k1 and x2y2 as k2) as the centroids. Then we measure a Euclidean distance between k1 and one of the remaining data points (i.e., x1y1 through x10y10). This is repeated for k2 as well. Each data point is assigned to the cluster based on the lowest Euclidean distance(which we discussed before). The clusters then get readjusted by averaging the data points of that cluster again. This procedure continues until:
- i) the pre-defined iterations are achieved
- ii) the centroids get no longer adjusted.
The ‘means’ in the K-means refers to the averaging of the data points to find the centroid. Also read about cluster analysis and its application in business.
A real-time business use case where K-means is preferred to KNN
Suppose we have a customer database of the telecom industry with labeled inputs such as- state of residence, #of domestic and international calls per day, and #of total units of phone calls per day. So, when a new customer enters into the database, using KNN we can predict the # of phone calls the customer can make. However, to increase revenue, the telecom company might want to understand what kind of packages could be offered and at the same time what suits the customer needs. So, to segment this database based on the similarity of customer behavior, the K-means algorithm will be used.
As you can see here both K-Means and KNN are useful machine learning algorithms. K-Means clustering is an unsupervised machine learning algorithm while KNN is a supervised learning algorithm and the usage depends on the business context.