Retentioneering is a data-driven approach in data science and marketing analytics for customer retention and to get customers to come back to the products and services. There is a wide application of retentioneering on e-commerce websites and social media platforms and AI applications. There is a python library called retentioneering that makes analyzing clickstream data, user paths, and event logs much easier. In this article, I will discuss various functions available in retentioneering library to analyze clickstream data as utilized in my marketing data science project.
The clickstream data of users are usually large in volume, so it brings in associated data engineering challenges like cleaning and processing of the data, which are addressed by data science and machine learning algorithms. The retentioneering library in python is used in conjunction with other machine learning methods to identify trends and patterns in the clickstream data. We can use retentioneering to explore user behavior, segment users, create a customer journey map, and form hypotheses about what drives users to the desired actions. Retentioneering analysis helps us to identify hidden patterns and how customers and users navigate a website.
Retentioneering in python
Retentioneering is mainly divided into two parts: Preprocessing and Path analysis. In preprocessing part of retentioneering library in python, we find a wide range of methods specifically designed for processing clickstream data, which can be called either using code, or via the preprocessing GUI. With the help of the preprocessing part, separate methods for grouping and filtering events, splitting clickstream data into sessions, and much more can be used to enhance the analysis. And in the path analysis part, a powerful set of techniques and functions are used for performing in-depth analysis of customer journey maps. The tools feature informative and interactive visualizations that make it possible to quickly understand in very high resolution the complex structure of clickstream data. Both the preprocessing and path analysis parts help in analyzing user behavior in marketing analytics and customer analytics projects.
Built-in functions of Retentioneering: There are many built-in functions present in retentioneering library. The most important ones are explained below.
* Event stream – It is the core class in the retentioneering library. It is an internal data frame for retentioneering library. To see the transformed data, we need to convert the event stream into a data frame. The class constructor expects the data frame to have at least 3 columns: user_id, event, timestamp. So if we do not have these columns in our input data we can rename the input data columns.
* Step Matrix – It’s a powerful function in the Retentioneering library. It allows a quick high-level understanding of user behavior. The step matrix features powerful inbuilt options to customize the result based on the objective or goal of the analysis. We can visualize this dataset as a step-wise heatmap, indicating the distribution of the events appeared at a specific step/click.
* Weighting Step Matrix – So far, we have been defining step matrix values as the shares of users appearing at a certain step. However, sometimes we want to see it over some other entities not over users – typically, over user sessions. There we can use the weighting step matrix function.
* Centered Step Matrix – The above two matrices are over users and sessions but sometimes we are interested in the flow of users through a specific event to answer questions like how do users reach a specific event and what do they do afterwards or before the specific event. There we can use the centered step matrix function.
* Differential Step Matrix – Sometimes we would like to compare behaviors of multiple groups of users – for example, the users who had a target event versus those who had not. Here also we can choose a specified event like a centered step matrix. For example, we have two groups i.e G1 and G2, so with the help of a differential step matrix we can compare the groups before or after the specified event.
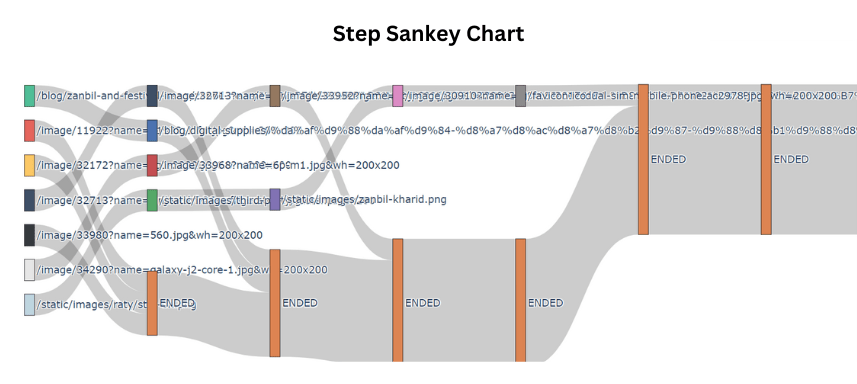
* Step Sankey – It is a diagram representing clickstream data as a stepwise directed graph. The nodes are associated with events that appear at a particular step in a user’s path. The nodes are grouped into columns in stepwise manner.
*Transition Graph – It is a weighted directed graph that illustrates how often the users from an event stream move from one event to another. We can control the edge weight value by its built-in parameters.
I used the python library of retentioneering and the available functions in my analytics project to analyses the clickstream data of users. Understanding customer behavior and their journey are important elements of any marketing analytics initiative to devise marketing strategies. I found useful information about the web users using this library, for example, after which click my users are exiting, what percentage of users are visiting a specific event at which click etc. I have compared user behavior from a specific event and also presented the insights through the diagrams and visualizations. Since the clickstream data of users is big in size, these machine learning methods are very useful to apply on large data and ‘see’ the data through relevant visualizations and graphs.
In conclusion, it is important to note that the library provides a wide range of built-in functions, including funnels, cohorts, clusters, and more. When organizations are using data-driven marketing strategies, these data science libraries and functions are useful not only to understand user behavior but also to guide them to various paths and events on a website. By enabling organizations to explore deeper into their data, these techniques offer information and insights about users and help in customer retention strategies.
About Author:This article is contributed by Yashaswini Borar. She completed her Data Science Training at Data Brio Academy and wrote this article based on her internship project completed at Business Brio, an award-winning Data Science and Analytics company.


