

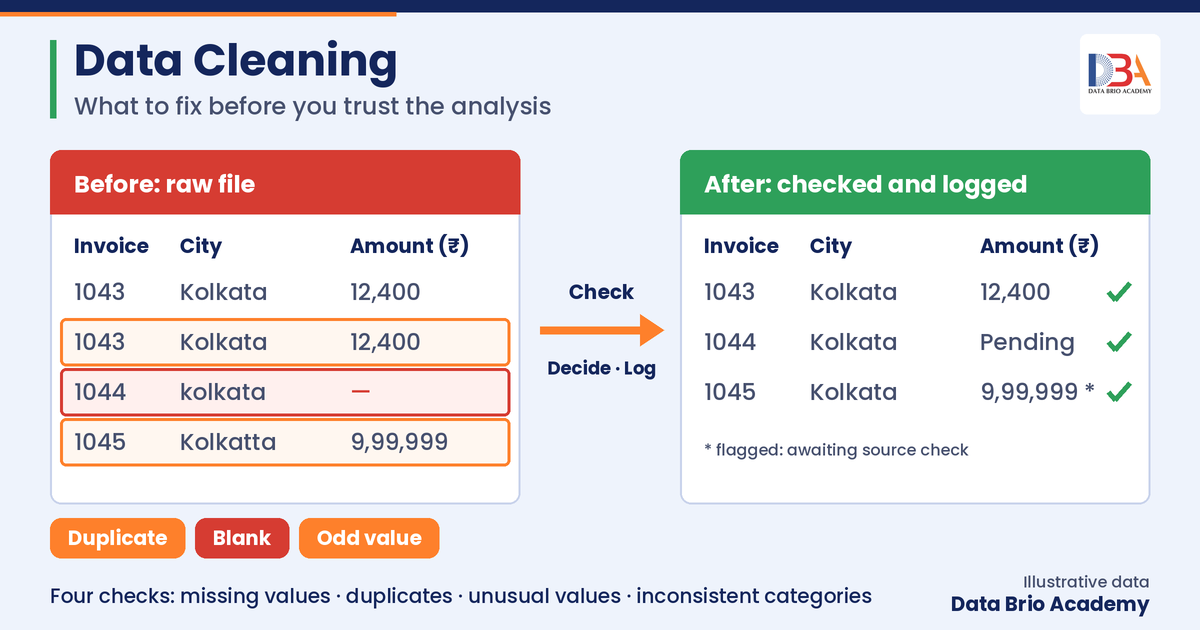
Before you trust an analysis, start with data cleaning: check the file for four things: missing values, duplicate records, unusual values and inconsistent categories. Then write down every change you make and why. A report can show a clean total and a confident chart even when the file behind it has never been checked.
This article is a data cleaning decision guide. It does not teach a tool. It explains what to look for, what each problem can mean, and when the right move is to leave a value alone.
Why can an analysis look right and still be wrong?
Software does not question the data it is given. A spreadsheet will add up a column that contains a duplicate invoice. A dashboard will draw a bar for a city that is spelled three different ways. Nothing flashes red.
That is why the first question in any analysis is not “which chart?” but “what is in this file?” Our guide to the data analytics framework lists cleaning as one step in the process. This article takes that one step and shows how to do it well.
A small example to work with
Imagine a sales file for one city. These four rows are enough to show most of the problems data cleaning has to solve. The figures are illustrative, not from a real client or dataset.
| Invoice | City | Amount (₹) |
| 1043 | Kolkata | 12,400 |
| 1043 | Kolkata | 12,400 |
| 1044 | kolkata | (blank) |
| 1045 | Kolkatta | 9,99,999 |
Add this file up and you get a total. It will look reasonable. Now look at each problem in turn.
What should you do about missing values?
In data cleaning, start by asking what the blank means. In the example, invoice 1044 has no amount. There are at least three possible reasons:
- It was never recorded. Someone forgot to enter it.
- It does not apply. A free replacement, for instance, may have no amount.
- It has not happened yet. A payment may still be pending.
Each reason points to a different action. You can leave the blank as it is, fill it using a rule you state openly, exclude the row from the calculation, or go back to whoever owns the source and ask. What you should not do is let the tool quietly treat the blank as zero without knowing that it did.
Are duplicate records always errors?
No. Invoice 1043 appears twice with the same city and amount. It may be an entry typed twice. It may also be two genuine purchases that happen to share a number because of a system fault, or a customer who bought the same item twice on the same day.
Good data cleaning compares the full rows, not only the ID. Look at dates, times, customer and product. If every field matches and the invoice number is supposed to be unique, a duplicate entry is the likely explanation. If other fields differ, you may be about to delete real sales, and the revenue figure would then be wrong.
Is an unusual value a mistake or a finding?
Invoice 1045 shows 9,99,999 in a file where other orders are in the thousands. There are three common explanations:
- A typing error. An extra digit or a misplaced comma.
- A placeholder. Values such as 99999 or 999999 are often typed in when the real number is not known.
- A genuine bulk order. An unusual customer, a one-off contract or a festive-season purchase.
The right action depends on which it is: correct it, exclude it, or study it. A real bulk order may be exactly what the business needs to understand, so deleting it first and asking later can remove the finding. Check the source before you decide, and if you do exclude it, say so and show the result both with and without it.
Why do inconsistent categories distort results?
“Kolkata”, “kolkata” and “Kolkatta” are one city. A report that groups by city will count them as three, and each will look smaller than the real total. The same happens with product names, branch names, payment modes and any other typed label.
Look for differences in capital letters, extra spaces, spelling variants and mixed formats such as dates written in more than one style. Good data cleaning means agreeing on one standard form for each category, apply it to the whole column, and keep a record of the mapping you used.
When should data cleaning stop: what not to remove?
Cleaning is judgement, not tidying. Three situations call for restraint:
- The odd value is the story. A sudden spike or a missing region may be what the business needs to see.
- You cannot yet explain it. If you do not know why a value looks wrong, you do not yet know that it is wrong.
- Removing it changes the question. Dropping every incomplete row may leave you analysing only the customers whose records were easy to complete.
When in doubt, keep the original data untouched, make changes in a copy, and treat any unusual value as a question for the data’s owner before treating it as an error.
Why keep a data cleaning log?
A data cleaning log is a short written record of what you changed, why, and how many rows were affected. It takes minutes to keep and saves a great deal of confusion later. For the example file it might read:
| What changed | Why | Rows affected |
| Removed repeat of invoice 1043 | All fields matched; invoice number should be unique | 1 |
| Standardised city to “Kolkata” | Three spellings of one city | 2 |
| Amount for 1044 left blank, excluded from totals | Source team to confirm whether payment is pending | 1 |
| 9,99,999 flagged, not deleted | Possible placeholder or bulk order; awaiting source check | 1 |
With a log like this, anyone can see how the final number was reached, and anyone can reverse a decision that turns out to be wrong.
What is the main takeaway?
An analysis is only as trustworthy as the data cleaning done before it. Look at missing values, duplicates, unusual values and inconsistent categories. Decide what each one means before you decide what to do. Keep the original data, change a copy, and write the changes down.
Data cleaning belongs inside the wider project, not before it or after it. If you want to see where it sits, read our overview of the data science project lifecycle. If you want to practise these checks in code, our introduction to Python libraries for data science: NumPy, Pandas and Matplotlib is a practical starting point, because Pandas is the library most analysts use for this work.
Related reading from Data Brio Academy
- The Data Analytics Framework: the step-by-step process that data cleaning belongs to.
- The Data Science Project Lifecycle: where data cleaning sits across a whole project.
- Introduction to Python Libraries for Data Science: NumPy, Pandas and Matplotlib: the tools for practising these checks.
Data Brio Academy (DBA) is a Data Science and AI training institute in Kolkata, focused on practical, application-oriented learning. Learn more at databrio.com.