

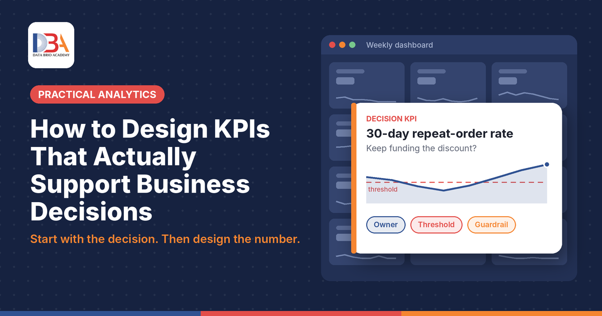
A KPI is useful when it changes a decision. To do that, it needs four things a plain metric does not: a specific decision it informs, a precise written definition, a threshold that tells someone when to act, and an owner who is responsible for acting. Most dashboards have plenty of numbers; far fewer have numbers built this way.
This guide shows how to design KPIs starting from the business decision rather than from whatever data is easiest to count. It uses one worked example from start to finish: an online grocery business deciding whether a discount campaign was worth it.
What is the difference between a metric and a KPI?
A metric measures something: orders, website visits, calls handled, rows processed. A KPI (key performance indicator) is a metric that has been deliberately tied to a decision, with a definition, a threshold and an owner. Every KPI is a metric. Not every metric deserves to be a KPI.
A simple test separates the two. Ask of any number on a dashboard:
If this number moved sharply tomorrow, would anyone do anything differently?
If the honest answer is yes, and you can say who would act and how, the number is behaving like a KPI. If the answer is no, the number may still be worth tracking as context. It just isn’t doing the job of a key indicator, and it probably does not belong in the headline row of a dashboard.
This matters because attention is limited. A dashboard with thirty “key” indicators usually has three that people act on and twenty-seven that they glance at. Designing KPIs well is mostly about choosing, and defining, the few that carry decisions.
Why should KPI design start with the decision?
KPIs designed from the data tend to measure what is easy to count. KPIs designed from the decision measure what the business needs to know. The difference is easiest to see in an example.
The example (illustrative). An online grocery business runs a three-week discount campaign for new customers. During the campaign, orders per month rise sharply. The weekly report shows a healthy upward line and the campaign is declared a success.
But the question in front of the team is not “did orders go up?” Discounts almost always lift orders; that is what they are for. The decision the team actually faces is:
Should we keep paying for this discount next month?
“Orders per month” cannot answer that. To decide, the team needs to know whether the customers the discount attracted come back, and whether their orders make money once the discount is gone. That points to a different set of numbers:
| Role | Measure | What it tells the team |
| Reporting metric | Orders per month | Activity went up. Says nothing about whether the discount paid off. |
| Decision KPI | 30-day repeat-order rate for customers acquired through the campaign | Whether the discount brought customers who stay. |
| Leading indicator | Share of new customers who return to browse within 7 days | An early warning, before the 30-day result is known. |
| Guardrail | Margin per order | Whether repeat orders are profitable, not just frequent. |
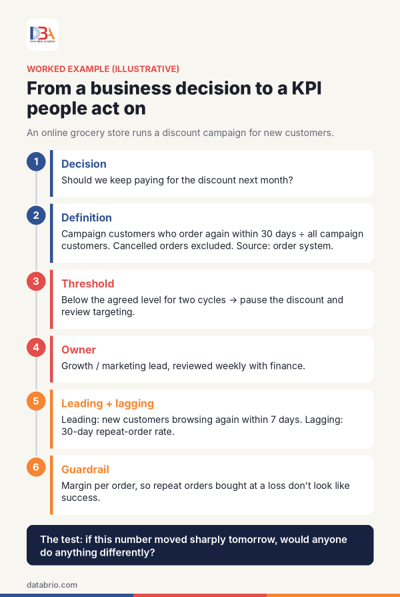
From a business decision to a KPI people act on: the grocery example in six steps.
The data behind all four rows comes from the same order system. What changed is the question. Once the decision is written down, the right KPI usually follows from it; when it is left vague, teams default to whatever number is already on the dashboard.
A useful way to begin any KPI conversation is therefore to write one sentence: “This number will help [owner] decide whether to [action].” If that sentence cannot be completed, the team is not yet ready to choose a KPI.
How precisely should a KPI be defined?
Precisely enough that two people working separately would calculate the same number. Many KPI disputes are not about performance at all; they are about definition. “Active customer” means ordered in the last 30 days to one team and the last 90 days to another. “Revenue” is before returns for one report and after returns for the next. Both teams are right by their own definition, and the meeting turns into a debate about whose number to believe.
A usable KPI definition answers four questions:
- What is counted, and divided by what?
- Time window. Over what period: 7 days, 30 days, a calendar month, a campaign cycle?
- What is included and excluded: cancelled orders, returns, test accounts, staff purchases?
- Which system is the record of truth when two systems disagree?
For the grocery example, the written definition might read: customers whose first order used the campaign code and who placed another order within 30 days, divided by all customers acquired through the code; cancelled orders excluded; source: the order management system.
A precise definition also depends on clean data underneath it. Duplicate customer records, inconsistent category labels or missing order dates will quietly change a KPI even when the definition is perfect. Our guide Data Cleaning: What to Fix Before You Trust Your Analysis covers those checks in detail.
What turns a number into something people act on?
A threshold and an owner. Without them, a KPI is watched rather than used.
The threshold says in advance what level triggers what response. “We will monitor the repeat rate” is not a plan. “If the 30-day repeat rate stays below the level we agreed for two campaign cycles, we pause the discount and review who it is targeting” is a plan. Agreeing the threshold before the results arrive also avoids a common trap: deciding what counts as good only after seeing the number.
Thresholds do not need to be precise targets on day one. For a new KPI, a team can start with a range based on recent history and tighten it once a few cycles of data exist. What matters is that the action attached to each side of the threshold is written down.
The owner is the person responsible for noticing when the KPI moves and proposing what to do. A KPI that belongs to “the team” usually belongs to nobody. In the grocery example, the owner might be the growth or marketing lead, with the number reviewed weekly alongside finance, since the decision involves both customer behaviour and cost.
A quick check for any proposed KPI: can you name the owner, the threshold and the action in one sentence? If not, it is not ready for the headline row of a dashboard.
Why does a KPI need a leading indicator and a guardrail?
Because one number on its own is easy to misread, and easy to game.
Leading and lagging. A lagging indicator confirms what has already happened; a leading indicator gives an early signal of where it is heading. The 30-day repeat-order rate is lagging: the team must wait a month to see it. The share of new customers who come back to browse within seven days is leading: it arrives sooner and tends to move in the same direction. Most decisions need one of each, so the team can act early and confirm later.
Guardrails. When people are judged by a number, they find ways to move the number, including ways that hurt the business. Economists and management writers have noted this for decades; it is often referred to as Goodhart’s law. The grocery team could lift repeat orders simply by making the discount bigger, while losing money on every order.
A guardrail is a second measure that shows when the first is being improved in the wrong way. It is not a target in itself; it is a check. Common pairings look like this:
| KPI | Guardrail | What the guardrail catches |
| 30-day repeat-order rate | Margin per order | Repeat orders bought with discounts that lose money |
| Average call handling time | Issues resolved on first contact | Calls ended quickly without solving the problem |
| New accounts opened | Value of first purchase | Accounts opened that never buy |
| Tickets closed per week | Tickets reopened within 7 days | Tickets closed before the issue is fixed |
If a team cannot think of a way the KPI could be improved while the business gets worse, it has probably not thought hard enough. That conversation is where the guardrail comes from.
When should a KPI be retired, and when is a simple metric enough?
KPIs should be reviewed on a schedule, not only when something goes wrong. Businesses change: a measure that drove decisions during a launch may not matter two years later. A quarterly review can ask of each KPI whether the decision it was built for still exists, whether anyone acted on it in the last period, and whether its definition still matches how the business works.
Retiring a KPI does not mean deleting data. The number can move off the headline view to a detail page, where it remains available as context. The aim is to keep attention on the few numbers that still carry decisions.
Not every number needs to be a KPI either. Plenty of metrics are useful for understanding what is happening: daily orders, website visits, stock levels. They help people investigate, spot problems and answer questions. They simply do not need owners, thresholds and guardrails. Turning every metric into a KPI recreates the problem this guide started with: a dashboard full of “key” numbers that nobody acts on.
How those KPIs are then displayed is a separate design question. For choosing the right chart for each kind of number, see our guide on when to use which chart for data visualization and analytics.
The KPI design checklist
Before a number goes on the headline row of a dashboard, it should be able to answer six questions:
- Decision: which decision will this number inform?
- Definition: what exactly is counted, over what period, with what exclusions, from which source?
- Threshold: at what level does someone act, and what do they do?
- Owner: who is responsible for acting?
- Leading and lagging: is there an early signal as well as a confirming result?
- Guardrail: what second measure shows if this one is being improved in a way that hurts the business?
If a proposed KPI cannot answer the first question, it may still be a useful metric. It just is not a KPI yet.
Conclusion
Good KPIs are designed, not collected. They start from a decision someone has to make, carry a definition precise enough that two people get the same answer, and come with a threshold, an owner and a guardrail. In the grocery example, the same order data supported two very different stories: “orders went up” and “the discount brought customers who came back profitably, or did not”. Only the second helps the team decide what to do next month.
The practical habit is simple. Before charting a number, ask which decision it supports. Then design the number around that decision.
Further reading on databrio.com
- How can a Data Science course help you in data visualization techniques? Where KPIs sit within dashboards and visual reporting.
- When to use which chart for data visualization and analytics Choosing the right chart once your KPIs are defined.
- Data Cleaning: What to Fix Before You Trust Your Analysis The data checks a reliable KPI depends on.
- What Is Data Science? What It Adds Beyond Reports and Dashboards What changes when the question moves beyond reporting.
Want to build this skill? Turning business questions into well-defined measures is a core part of an analyst’s work. Our guide How to Become a Data Analyst in the AI Era sets out the wider skill set, from SQL and Excel to communicating results.